Info Design
In each piece, I was given raw data or text to visualize. I had to organize, prioritize, and design the information so it was compelling and clear to understand.
Brooklyn Vegan Maps
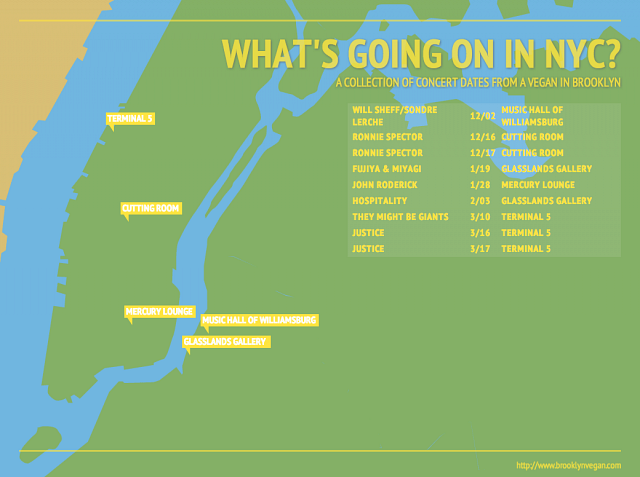
Living in Brooklyn, I used brooklynvegan.com to find out about concerts, but their blog platform did not provide an easy way to filter for concert dates and venues. I scraped the Brooklyn Vegan website and filtered for dates and times, and then grabbed the corresponding band names and venues to visualize on a map of NYC.
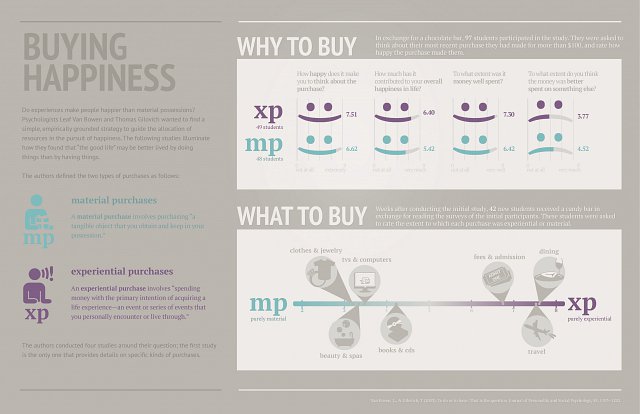
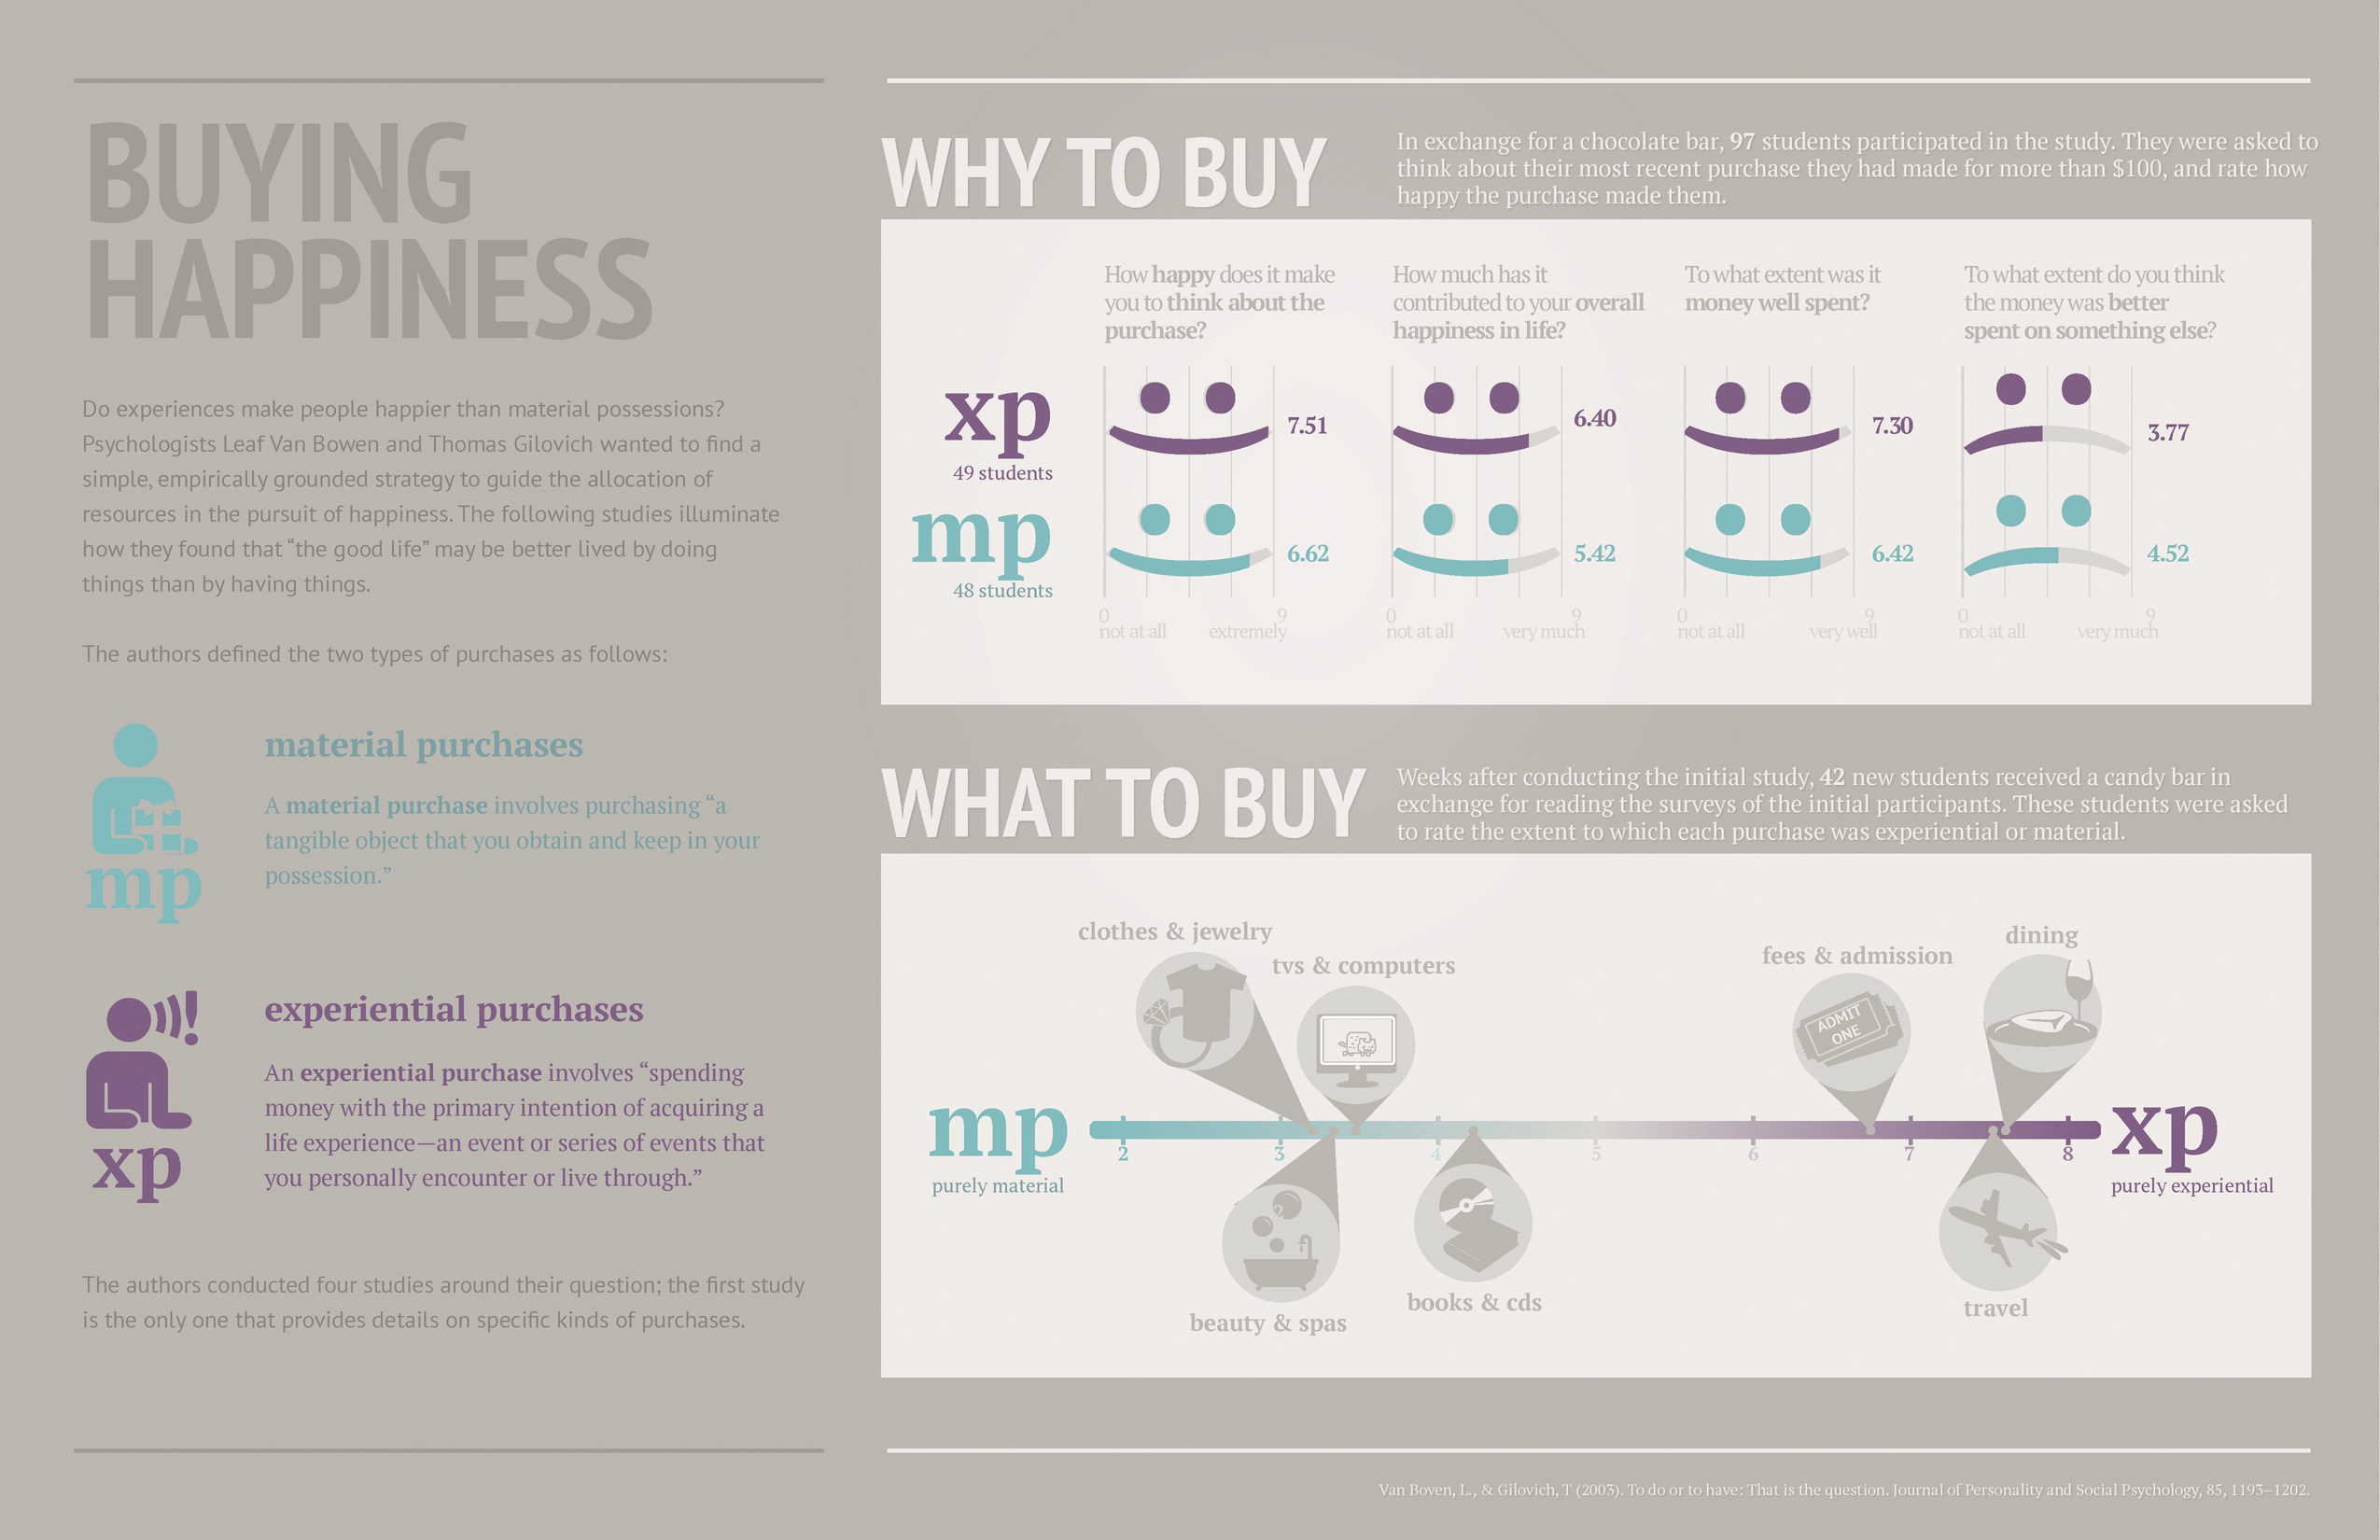
Buying Happiness
This infographic summarizes the findings of a paper on the correlation between happiness and material or experiential purchases, titled "To do or to have: that is the question."
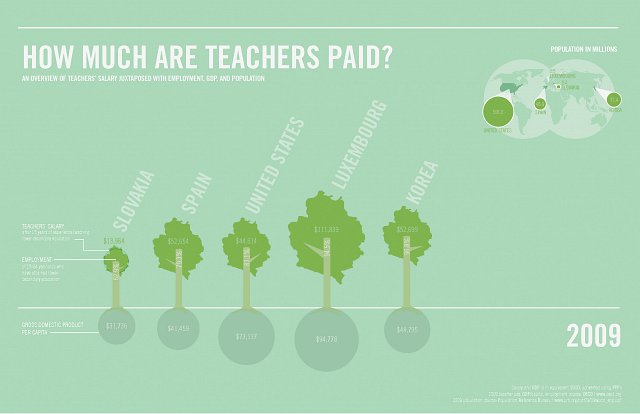
Teacher Salary Around the World
This infographic was created from a table of raw data about teacher pay.